
Have questions about this report? Ask the author(s).
State and local government appropriations for public higher education — community colleges and universities combined — in Arizona as of fiscal year (FY) 2022 were considerably below the amount needed to equal the national average per full-time-equivalent (FTE) student. Adjusted for the cost of living, state and local government appropriations needed to be more than $900 million higher for Arizona to rank in the middle of the 50 states per FTE student and more than $1.2 billion higher for Arizona to equal the U.S. average per FTE student.
After adjustment for the cost of living, Arizona’s state and local government support (appropriations) for public higher education per FTE student in FY 2022 was 39.1 percent less than the national average and ranked 49th among the 50 states, with only New Hampshire having a lower figure.
State government appropriations for public higher education per FTE student adjusted for the cost of living were 63.0 percent less than the national average in Arizona and the lowest among the states in FY 2022. In contrast, local government support was the third highest in the country in Arizona at 2.62 times higher than the national average. Local government support in Arizona is limited to community colleges.
Net tuition and fees is another significant source of higher education revenue. It is calculated as gross tuition and fees minus financial aid from state and institutional sources. Per FTE student adjusted for the cost of living, net tuition and fee revenue in Arizona in FY 2022 was 25.2 percent higher than the national average and ranked 20th nationally. In total, net tuition and fees was 45 percent higher than the funding from educational appropriations in Arizona in FY 2022.
Total educational revenue for higher education — appropriations and net tuition and fees combined — per FTE student was 14.5 percent less than the national average in Arizona in FY 2022. Arizona ranked 47th nationally, with only Nevada, Louisiana, and Florida lower.
A stark difference exists in public support for universities versus community colleges in Arizona. Arizona’s FY 2022 state and local government appropriations for universities per FTE student were 62.5 percent below average, second lowest in the nation, while for community colleges, the figure was 24.1 percent above average, eighth highest in the nation. The dollar value of educational appropriations per FTE student was 3.5 times as much for community colleges as for universities in Arizona in FY 2022.
The situation is reversed for net tuition per FTE student in Arizona. In FY 2022, net tuition and fees in Arizona adjusted for the cost of living was 18.0 percent above average for university students, 17th highest in the nation, while the figure for community colleges was 13.7 percent below average, 43rd highest in the nation.
Despite the high university tuition, total educational revenue for universities in Arizona in FY 2022 was 23.9 percent below the national per FTE student average, ranking 46th. Total educational revenue for community colleges in Arizona in FY 2022 was 16.7 percent above the national per FTE student average, ranking 18th.
In FY 2022 nationally, appropriations by state and local governments accounted for 58.9 percent of the total revenue of community colleges and universities combined. The share contributed by state and local funding was considerably lower in Arizona at 41.9 percent. Arizona’s share ranked 39th nationally. Thus, relative to most states, Arizona places a higher share of the cost of higher education on students than on society as a whole.
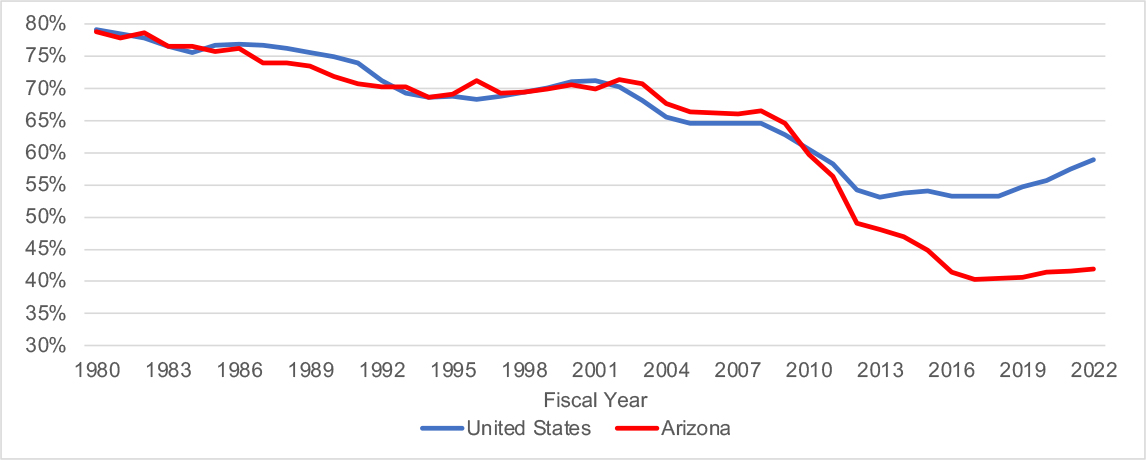
Historically, the share of total higher educational revenue from appropriations of state and local governments was similar in Arizona to the national average; the share was more than 75 percent in the early 1980s. As seen in Chart S-1, the share of total higher educational revenue from state and local government appropriations has diverged sharply since FY 2009 in Arizona relative to the U.S. average. Between FY 2009 and FY 2022, the share fell 4 percentage points nationally compared to 23 percentage points in Arizona.
Chart S-1: EDUCATIONAL APPROPRIATIONS AS A SHARE OF TOTAL EDUCATIONAL REVENUE FOR PUBLIC HIGHER EDUCATION

Dennis received a B.A. in economics and mathematics from Grand Valley State University, a M.S. in economics from Michigan State University, and a Ph.D. in economics from Michigan State University in 1978. He has served on the faculty of the Department of Economics at ASU since 1979, as director of ASU’s L. William Seidman Research Institute (2004-24), and as the director of the Office of the University Economist since 2005.

After receiving his Bachelor of Business Administration from the University of Toledo, Tom earned his Master of Business Administration from Arizona State University in 1976. After working in the private sector, he joined ASU in 1980, working for the predecessor of the L. William Seidman Research Institute. Since 2005, he has served as manager of research initiatives in the Office of the University Economist.

This infographic estimates the total (direct, indirect and induced) economic impacts of the infusion of new dollars associated with Sun Devil Football regular season home games in 2024-25 season the…
This infographic estimates the total economic impacts of Sun Devil Athletics' 2024-25 season in the city of Tempe and Maricopa County.
Focusing on the regular seasons of 11 ticketed Sun Devil Athletics sports and two National Collegiate Hockey Conference Quarter Finals, it estimates the…
An update to the November 2023 paper that presented data through 2022, estimates are presented of the number of ASU graduates working in Arizona, as well as their average wage, aggregate wages, and tax payments. Estimates are made for each year from 2012 through 2023.