
Have questions about this report? Ask the author(s).
Arizona would benefit from changing course in its economic development efforts, from an emphasis on aggregate growth rates and tax reductions to a focus on investing in itself.
Since the late 1960s, when reductions in taxes began, Arizona has been one of the fastest-growing states in the nation, though the fast growth cannot be traced to the tax cuts. This rapid aggregate growth has been accompanied by declines relative to the nation and to comparison states in measures of productivity and prosperity. Improvements in productivity lead to gains in prosperity; the goal of economic development is to improve the economic well-being of residents.
In the early 1970s, Arizona’s prosperity, as measured by per capita gross domestic product, was within 5 percent of the U.S. average. Arizona ranked above the middle of all states and was fifth among a group of 15 comparison states. Arizona’s position has deteriorated considerably, especially since the mid-2000s (see Chart S-1). In 2021, Arizona’s prosperity was 17.8 percent below the national average, ranking 36th nationally and 11th among 15 comparison states.
Though the state has experienced some recent success in attracting semiconductor and electric vehicle manufacturing, this may not lead to improvements in productivity and prosperity. Similar success stories have occurred over the last 50 years, yet productivity and prosperity relative to the nation has declined. Such quality growth has been overwhelmed by the state’s overall fast and mediocre growth.
Arizona is not positioned to make much improvement in its prosperity. Arizona’s ratings in studies of the best states for business are mediocre. In particular, three surveys — of business consultants, site selectors, and corporate real estate executives — agree that the two most important business location factors that can be affected by local policy makers are skilled labor/education and physical infrastructure. Arizona does not compare favorably on these location factors. The educational achievement of the state’s students is below average, as is the educational attainment of Arizona’s adults. The state’s physical infrastructure is rated as average in most categories and worse in the roads category, which is particularly important to economic development.
The public sector has a major role to play in supplying education to the state’s residents and in providing some types of physical infrastructure, such as highways. Yet, public investments in physical infrastructure and in education have fallen substantially in Arizona relative to the nation, to considerably below the national average (see Charts S-2 and S-3). The reduction in expenditures has been a necessary outcome of the many tax cuts passed over the past 55 years, particularly during the last 30 years, that has greatly reduced the revenue available to fund public programs. In fiscal year 2020, Arizona state and local government revenue was $17 billion less than what was needed to equal the national per capita average after adjusting for the cost of living. The loss of revenue has resulted in spending reductions relative to the nation for education and most other public programs. While the tax reductions have put Arizona’s tax burden considerably below the national average for both businesses and individuals, the tax cuts have had no discernible positive impact on the state’s economic performance.
Chart S-1: Prosperity as Measured by Per Capita Gross Domestic Product, Arizona as a Percentage of the National Average
Source: Calculated from U.S. Department of Commerce, Bureau of Economic Analysis.
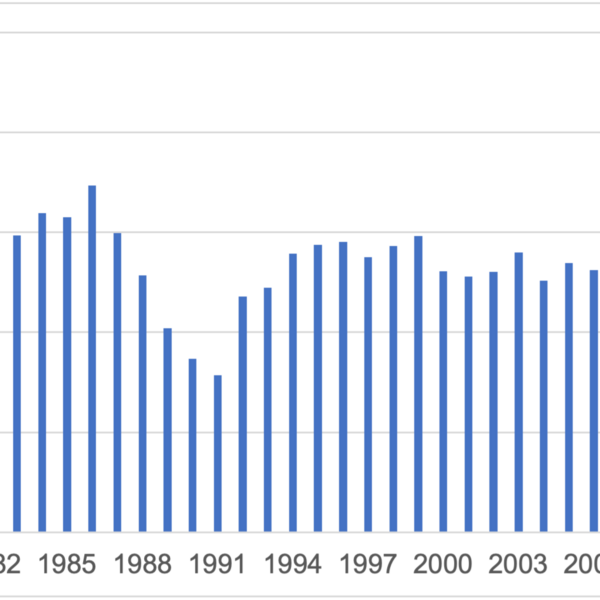
Chart S-2: Capital Outlays Per Capita Expressed as a Centered Five-Year Moving Average, Arizona as a Percentage of the National Average
Source: Calculated from U.S. Department of Commerce, Census Bureau, Annual Survey of State and Local Government Finances (capital outlays) and U.S. Department of Commerce, Bureau of Economic Analysis (population).
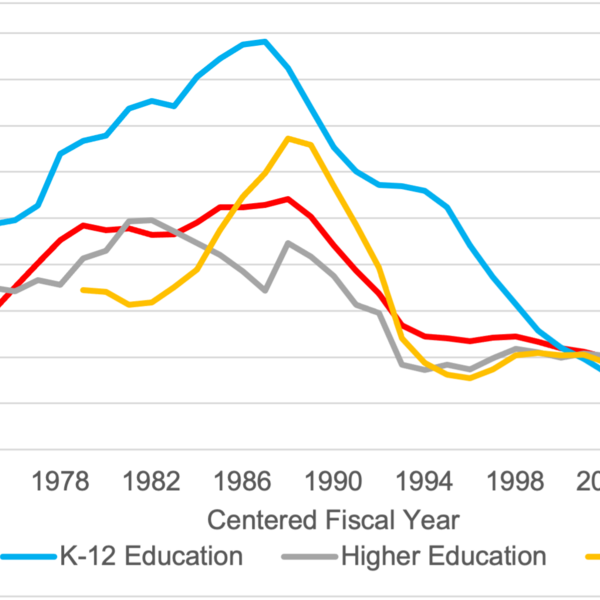
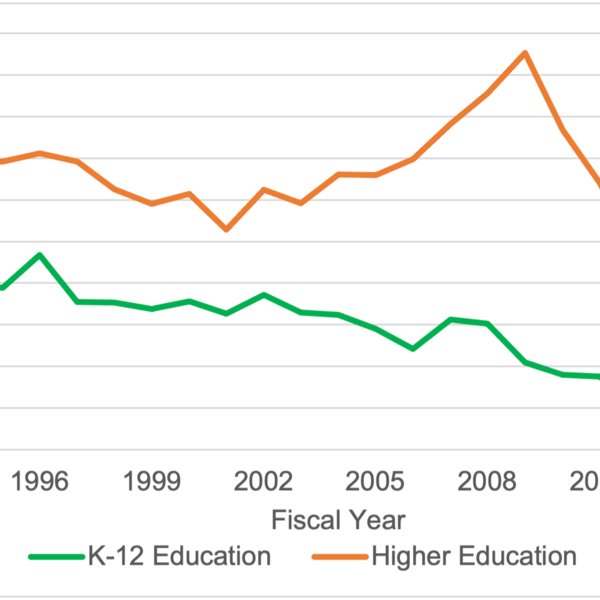
Chart S-3: Funding Per Student for Education, Arizona as a Percentage of the National Average
Notes:
Funding is defined as state and local government revenue.
Higher education enrollment is measured on a full-time-equivalent basis.
Source: Calculated from U.S. Department of Commerce, Census Bureau, Annual Survey of School System Finances, and State Higher Education Executive Officers Association, SHEF State Higher Education Finance, FY 2021.

Dennis received a B.A. in economics and mathematics from Grand Valley State University, a M.S. in economics from Michigan State University, and a Ph.D. in economics from Michigan State University in 1978. He has served on the faculty of the Department of Economics at ASU since 1979, as director of ASU’s L. William Seidman Research Institute (2004-24), and as the director of the Office of the University Economist since 2005.

After receiving his Bachelor of Business Administration from the University of Toledo, Tom earned his Master of Business Administration from Arizona State University in 1976. After working in the private sector, he joined ASU in 1980, working for the predecessor of the L. William Seidman Research Institute. Since 2005, he has served as manager of research initiatives in the Office of the University Economist.

This infographic estimates the total (direct, indirect and induced) economic impacts of the infusion of new dollars associated with Sun Devil Football regular season home games in 2024-25 season the…
This infographic estimates the total economic impacts of Sun Devil Athletics' 2024-25 season in the city of Tempe and Maricopa County.
Focusing on the regular seasons of 11 ticketed Sun Devil Athletics sports and two National Collegiate Hockey Conference Quarter Finals, it estimates the…
An update to the November 2023 paper that presented data through 2022, estimates are presented of the number of ASU graduates working in Arizona, as well as their average wage, aggregate wages, and tax payments. Estimates are made for each year from 2012 through 2023.