
Have questions about this report? Ask the author(s).
Worldwide, the goal of economic development is to improve prosperity, not simply to grow in economic size. Aggregate growth rates, such as of population and employment, have little (if any) relationship to gains in prosperity.
Prosperity, which generally is measured on a per person basis, is in part dependent on productivity, which generally is assessed on a per worker basis. The employment-to-population ratio is another important aspect of prosperity. One means of assessing regional economic competitiveness is to examine how a region compares to its peers on indicators of productivity, the employment-to-population ratio, and prosperity.
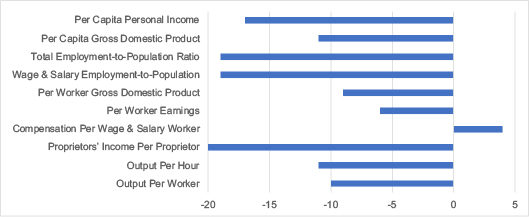
As seen in Chart S-1, Arizona was below the U.S. average in 2021 in each of the indicators after adjusting those indicators measured in dollars for the cost of living (which in Arizona was below the U.S. average). Similarly, Arizona ranked below the middle of the states on all but one indicator (see Chart S-2). Arizona was further below average on the per capita indicators than the per worker indicators since the state was below average on the employment-to-population ratio.
Since 1969, the earliest year of data for most indicators, Arizona has fallen further behind the national average on each of the productivity and prosperity indicators. However, Arizona improved relative to the national average on each of the indicators after adjusting for the change in the cost of living between 2008 (the earliest year of data on the cost of living) and 2021. This advance was largely due to Arizona’s decrease in the cost of living relative to the U.S. average — Arizona’s decline was the second greatest among the states.
The state’s two large metropolitan areas — Phoenix and Tucson — account for approximately 85-to-90 percent of the state’s economic activity and thus logically are largely responsible for the state’s poor performance on productivity, the employment-to-population ratio, and prosperity. Indeed, in 2021, the Phoenix and Tucson metro areas were considerably below the norm for like-sized metro areas (as measured by employment) on each of the indicators. In the rest of the state, however, the comparison to the average of similarly sized areas was mixed, with the Flagstaff, Sierra Vista, and Yuma metro areas and the nonmetro area comparing favorably on at least some of the indicators. Given the low employment-to-population ratio throughout the state except for Metro Flagstaff, most of the state was further below average on the prosperity indicators than on the productivity indicators.
Historically, the various areas of the state generally did not compare as poorly to similarly sized areas as in 2021. While some areas experienced a relative improvement in some indicators between 1969 and 2021 (on an unadjusted basis), deterioration over time was more common. However, largely due to the relative decline in the cost of living across Arizona, improvements in the cost-of-living-adjusted indicators were common between 2008 and 2021.
With the exception of Metro Flagstaff, which has an overall employment-to-population ratio slightly higher than the average of its peers, both the age distribution and the employment-to-population ratio by age group contribute to the low overall employment-to-population ratio. In most of the state, a low employment-to-population ratio in most or all age groups has more of an effect on the overall employment-to-population ratio than the age distribution.
CHART S-1
PRODUCTIVITY AND PROSPERITY INDICATORS, PERCENT DIFFERENCE FROM THE NATIONAL AVERAGE AFTER ADJUSTMENT FOR THE COST OF LIVING, ARIZONA 2021
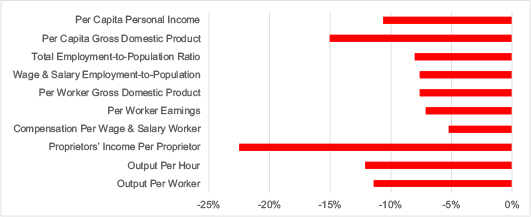
CHART S-2
PRODUCTIVITY AND PROSPERITY INDICATORS, RANK AMONG THE STATES AFTER ADJUSTMENT FOR THE COST OF LIVING, ARIZONA 2021
Notes:
The District of Columbia is one of 51 "states."
Ranks are expressed as the difference in rank from 26th (the midpoint). For example, the -20 value for proprietors' income per proprietor is equivalent to a rank of 46th, where a rank of 1 is best.
Source (Charts S-1 and S-2): Calculated from data of the U.S. Department of Commerce, Bureau of Economic Analysis, and the U.S. Department of Labor, Bureau of Labor Statistics

Dennis received a B.A. in economics and mathematics from Grand Valley State University, a M.S. in economics from Michigan State University, and a Ph.D. in economics from Michigan State University in 1978. He has served on the faculty of the Department of Economics at ASU since 1979, as director of ASU’s L. William Seidman Research Institute (2004-24), and as the director of the Office of the University Economist since 2005.

After receiving his Bachelor of Business Administration from the University of Toledo, Tom earned his Master of Business Administration from Arizona State University in 1976. After working in the private sector, he joined ASU in 1980, working for the predecessor of the L. William Seidman Research Institute. Since 2005, he has served as manager of research initiatives in the Office of the University Economist.

This infographic estimates the total (direct, indirect and induced) economic impacts of the infusion of new dollars associated with Sun Devil Football regular season home games in 2024-25 season the…
This infographic estimates the total economic impacts of Sun Devil Athletics' 2024-25 season in the city of Tempe and Maricopa County.
Focusing on the regular seasons of 11 ticketed Sun Devil Athletics sports and two National Collegiate Hockey Conference Quarter Finals, it estimates the…
An update to the November 2023 paper that presented data through 2022, estimates are presented of the number of ASU graduates working in Arizona, as well as their average wage, aggregate wages, and tax payments. Estimates are made for each year from 2012 through 2023.