
Have questions about this report? Ask the author(s).
The migration efficiency — the ratio of the number of in-migrants to the number of out-migrants — of individuals between the ages of 16 and 26 who moved between commuting zones (CZs: aggregations of counties) during the 2000-to-2018 time period was the highest among the nation’s 26 most-populous CZs in the Denver CZ at 2.52. The Seattle CZ ranked second with an efficiency of 1.83 and the Phoenix CZ (Maricopa, Pinal, and Gila counties) ranked third at 1.78.
Among moderately populous CZs in the western and southeastern parts of the country, the Austin CZ ranked first with a migration efficiency of 3.17. With an efficiency of 1.30, the Tucson CZ (Pima, Cochise, and Santa Cruz counties) ranked in the middle. The young-adult migration efficiency of selected CZs is shown in Chart S-1.
In some CZs, including New York, Austin, Los Angeles, and Denver, migration efficiencies were much stronger in the higher income quintiles than in the lower income quintiles. In other CZs, including Fort Worth, Atlanta, Houston, and Seattle, migration efficiencies were stronger in the lower income quintiles than in the higher income quintiles. In the Phoenix CZ, migration efficiency was highest in the lowest income quintile and lowest in the highest quintile. In contrast, the migration efficiency in the Tucson CZ was slightly higher in the two highest quintiles than in the other three quintiles. A measure of the variation in migration efficiency across the income quintiles is displayed in Chart S-2 for selected CZs.
In Phoenix and Tucson commuting zones, young-adult migration efficiencies generally were highest with states in the East North Central, Northeast, and Middle Atlantic regions of the country. The weakest efficiencies were generally with states in the Pacific, Mountain, and West South Central regions. Though its overall young-adult migration efficiency was quite strong, the Phoenix CZ experienced net out-migration to six states: Colorado, Oklahoma, Texas, the District of Columbia, North Carolina, and Tennessee. Young-adult migration efficiency was lower in the Tucson CZ than the Phoenix CZ in 40 states, with southern states accounting for most of the exceptions. The Tucson CZ had net out-migration of young adults to 10, mostly western, states.
The Phoenix commuting zone’s in-migration, out-migration, and net migration flows of young adults were dominated by the Los Angeles CZ, though the migration rates and migration efficiency were not particularly high with the Los Angeles CZ. For both in-migration and net migration to the Phoenix CZ, the Chicago CZ ranked second, the Detroit CZ third, and the Las Vegas CZ fourth, though the efficiency was much lower with the Las Vegas CZ than the other two CZs. The Phoenix CZ’s efficiency was less than 1 with some CZs, with the net outflow greatest, and the efficiency least, with the Austin and Provo CZs.
The Tucson commuting zone’s greatest in-migration, out-migration, and net migration flows of young adults were with the Los Angeles CZ. For both in-migration and net migration to the Tucson CZ, the Chicago and Detroit CZs ranked near the top. The Tucson CZ’s efficiency was less than 1 with more than half of its largest migration partners.
Chart S-1: Young-Adult Migration Efficiency, Selected Commuting Zones
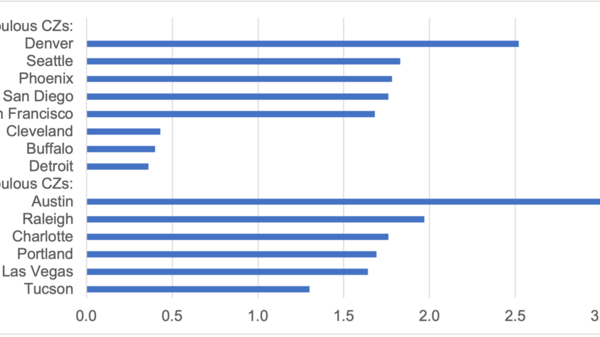
Source: Calculated from data from https://migrationpatterns.org/
Chart S-2: Young-Adult Efficiency Score, Selected Commuting Zones
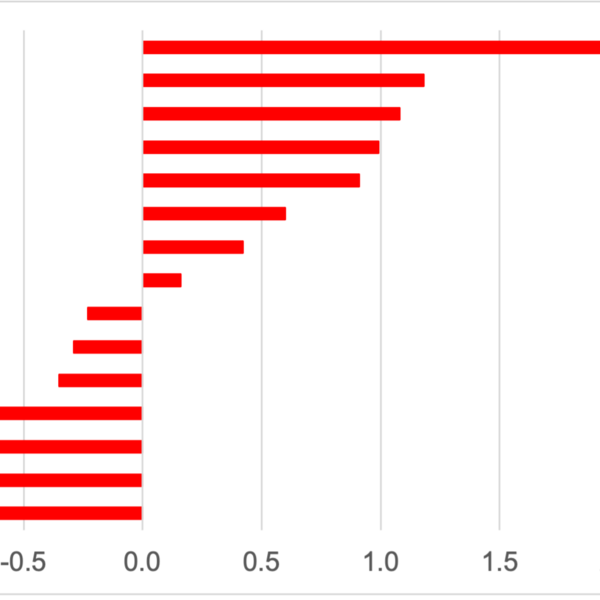
The efficiency score is calculated as the sum of (the difference in the efficiency between the highest income quintile and the lowest quintile) and (the difference in the efficiency between the second-highest income quintile and the second-lowest quintile). The higher the value of the efficiency score, the stronger the efficiencies in the higher income quintiles relative to the lower quintiles.
Source: Calculated from data from https://migrationpatterns.org/

Dennis received a B.A. in economics and mathematics from Grand Valley State University, a M.S. in economics from Michigan State University, and a Ph.D. in economics from Michigan State University in 1978. He has served on the faculty of the Department of Economics at ASU since 1979, as director of ASU’s L. William Seidman Research Institute (2004-24), and as the director of the Office of the University Economist since 2005.

After receiving his Bachelor of Business Administration from the University of Toledo, Tom earned his Master of Business Administration from Arizona State University in 1976. After working in the private sector, he joined ASU in 1980, working for the predecessor of the L. William Seidman Research Institute. Since 2005, he has served as manager of research initiatives in the Office of the University Economist.

An update to the November 2023 paper that presented data through 2022, estimates are presented of the number of ASU graduates working in Arizona, as well as their average wage, aggregate wages, and tax payments. Estimates are made for each year from 2012 through 2023.

Examines Arizona state government finance over time; compares Arizona to the nation and to other states on combined state and local government finance. Investigates public education finance and educational outcomes. Considers public-sector needs and suggests ways to boost revenue.

Summarizes migration data by state from three sources: the Internal Revenue Service, the American Community Survey, and the University of Wisconsin.
EXECUTIVE SUMMARY